Why it matters: A clock jitter number is only as trustworthy as the method used to obtain it. Engineers who skip straight to a standard-deviation reading risk reporting a figure that is dominated by the oscilloscope's own measurement noise rather than the clock under test. A methodical approach separates real jitter from instrument artefacts before a single number reaches a datasheet or a design review.
Step 1: Validate the Oscilloscope's Own Timebase First
Before measuring an unknown clock, characterise the instrument. Apply a known, stable reference frequency and measure its period across a long acquisition. Any variation observed is the oscilloscope's own sample-clock jitter, not jitter in the source. Expressing this as a fractional uncertainty in parts-per-million (PPM) gives a baseline noise floor—if that floor is not comfortably below the jitter you expect to measure on the actual clock, the result will be unreliable regardless of how carefully the rest of the measurement is performed.
Step 2: Establish the Expected Clock Period Visually
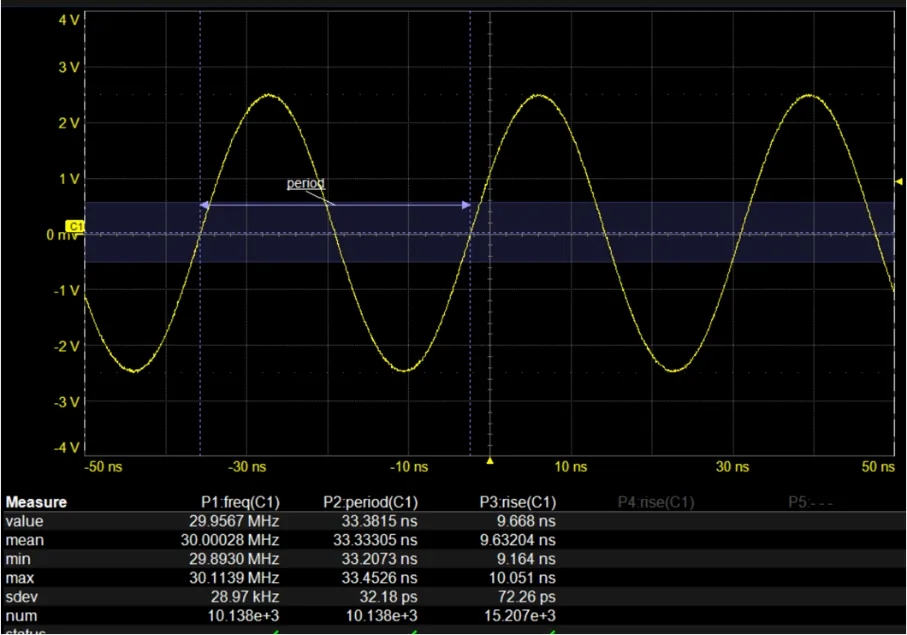
Before relying on any automated parameter, look at the waveform. Set volts/division and time/division so the signal fills a useful portion of the display, and note the approximate period and rise time by eye. This step catches gross setup errors—wrong probe attenuation, an aliased display, an unstable trigger—that would otherwise silently corrupt every downstream statistic.
Step 3: Measure Period Using Built-In Statistical Parameters
With the display confirmed sane, apply the oscilloscope's period or frequency parameter and read the mean value over many cycles. For example, a clock with a mean frequency of 48 MHz corresponds to a mean period of 20.83 ns. Cross-check this calculated value against the displayed mean—any mismatch points to a triggering or measurement-gating issue that needs to be resolved before jitter numbers are meaningful.
Step 4: Calculate Standard Deviation as the Jitter Metric
Once the mean period is confirmed correct, the standard deviation of that same parameter across the acquisition is the primary period-jitter figure, typically expressed in picoseconds. A clock running at 48 MHz with a period standard deviation in the low single-digit picoseconds is a common, healthy result for a well-designed clock source; sharply higher values warrant investigation of the clock generation circuit, power supply coupling, or the measurement setup itself.
Step 5: Extend the Timebase to Capture More Cycles
A short acquisition may not include enough cycles to represent the clock's real behaviour, especially if jitter has a slow, periodic, or intermittent component. Increasing the acquisition length—and therefore the number of periods captured—tests whether the standard deviation stabilises or keeps drifting as more data is included. A statistic that keeps changing significantly as acquisition length increases is not yet a trustworthy measurement.
Step 6: Confirm the Result with Track and Histogram Views
Plotting the period parameter as a track shows how it evolves cycle-to-cycle within the acquisition, revealing slow drift or periodic modulation that a single number would hide. Plotting the same parameter as a histogram shows the shape of the distribution: a symmetric, Gaussian shape is consistent with random jitter, while a skewed or multi-modal shape indicates a deterministic contributor that deserves separate characterisation—see Primeasure's guide to reading histogram distributions for how to interpret these shapes.
Step 7: Cross-Check Across Sample Rates
As a final robustness check, repeat the measurement at a different sample rate. If the reported jitter changes substantially with sample rate alone, the oscilloscope's acquisition system—rather than the clock—is likely influencing the result, and a higher sample rate or a different acquisition mode may be required to get a trustworthy answer.
Primeasure Field Tip
We treat Step 1 as non-negotiable. Skipping the oscilloscope self-characterisation is the single most common reason a customer's in-house jitter number and our bench measurement disagree—almost always because the instrument's own noise floor was never established relative to the clock being tested.
Primeasure POV
- Document your oscilloscope's characterised timebase jitter per bench and per sample-rate setting—treat it as calibration data, not a one-time check.
- Always report period jitter alongside the acquisition length used to calculate it; a standard deviation from a handful of cycles is not comparable to one from a million-cycle acquisition.
- Use track and histogram views together, not standard deviation alone—a single number cannot distinguish random jitter from a deterministic component that a track or histogram would reveal instantly.
- Teledyne LeCroy oscilloscopes support this full workflow natively—parameter statistics, track, histogram, and SDAIII jitter decomposition—without needing to export data to a separate analysis tool.
Need a Second Opinion on a Jitter Measurement?
Primeasure supports engineering teams across India with Teledyne LeCroy oscilloscopes and the measurement methodology needed to produce clock jitter numbers that hold up under scrutiny.
Explore Primeasure's Test & Measurement solutions available across India.
Talk to PrimeasureTopic informed by industry guidance on robust oscilloscope-based methods for measuring clock jitter.